Deploy complex forms instantly
Monitor submissions, track drop-offs, and optimize conversion paths with FormFlow’s live data engine.
Live Dashboard Overview
FormFlow processes over 2.4 million form events daily, pushing updates to your dashboard via WebSocket streams with sub-200ms latency. Watch submission spikes correlate with campaign launches in real time.
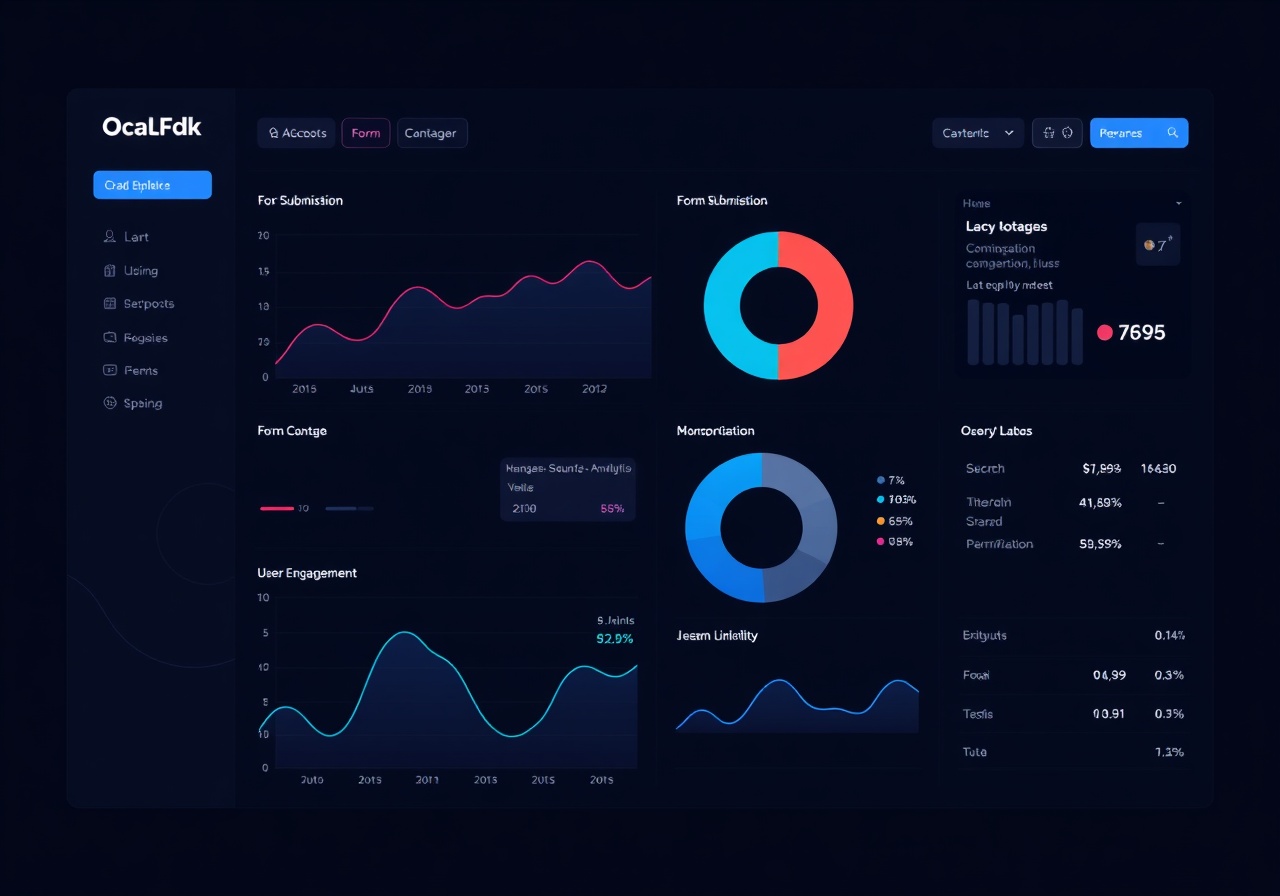
The control panel aggregates data from 14 integrated endpoints, including Stripe, Intercom, and your custom CRM. Filter by campaign UTM, device type, or geographic region without page reloads. Export raw CSV or JSON payloads for downstream warehouse processing.
Form Abandonment Tracking
Identify exactly where users disengage. FormFlow logs field-level exit events, capturing session duration, cursor movement, and input validation failures.
Step-Level Drop-Off
Monitor abandonment at each form stage. Our Q2 audit revealed a 14.7% drop at the tax ID verification step for fintech clients, resolved by implementing auto-formatting masks.
Session Replay Triggers
Flag high-value abandonments automatically. When a user spends over 90 seconds on a conditional logic block before exiting, FormFlow archives the DOM state for engineering review.
Recovery Workflows
Pair drop-off data with automated email sequences. Trigger partial-form save reminders to users who exited the billing address section, recovering up to 22% of lost leads.
User Engagement Heatmaps
Visualize interaction density across every form field. FormFlow’s heatmap engine renders click, hover, and scroll data directly over your embedded components.
Heatmaps update continuously as traffic flows in. Identify cold zones where users skip optional fields, and hot zones indicating confusion or repeated edits. The system flags fields with a click-to-focus ratio below 0.65, prompting UX audits. Teams at Meridian Health and Vertex Logistics use these insights to trim average completion times from 4.2 minutes down to 1.8 minutes.
Integration ReadyConnect heatmap data to your existing BI stack via our REST v3 API. Webhooks fire on threshold breaches, ensuring your product team never misses a friction spike.